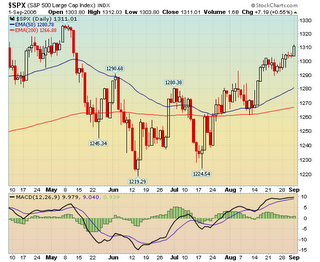
 Click chart to enlarge
Chart courtesy of http://stockcharts.com
What now? As usual we have confident bulls and hopeful bears. But the truth is that only one side will be right. I was thinking to myself that the market is at a critical juncture and where we go from here may well be a surprise.
One thing is sure: September has proven to be the most difficult month for stocks.
Looking at the S&P500 daily chart we find two options for the near future. If we believe in tricky setups we may accept the inverted Head & Shoulders of May/July (Head at 1219.29 and Shoulders at 1245.34 and 1224.54). Even if it proves to be valid it is no big deal. On the other way, we have a signal given by MACD Histogram which tells us that a bearish divergence is in place as S&P 500 higher highs collide with Histogram lower highs.
I know exactly what you are thinking: things are clear if we keep it simple and just notice that a fine trend line is heading north and on the way of breaking 1311. There is only one problem: markets are everything but simple!...

![[Most Recent Exchange Rate from www.kitco.com]](http://www.weblinks247.com/exrate/24hr-jpy-small.gif)
![[Most Recent Exchange Rate from www.kitco.com]](http://www.weblinks247.com/exrate/24hr-chf-small.gif)
![[Most Recent Exchange Rate from www.kitco.com]](http://www.weblinks247.com/exrate/24hr-cad-small.gif)
![[Most Recent USD from www.kitco.com]](http://www.weblinks247.com/indexes/idx24_usd_en_2.gif)
![[Most Recent Quotes from www.kitco.com]](http://www.kitconet.com/images/live/s_gold.gif)
![[Most Recent Quotes from www.kitco.com]](http://www.kitconet.com/images/live/s_silv.gif)
![[Most Recent Quotes from www.kitco.com]](http://www.kitconet.com/images/sp_en_6.gif)
![[Most Recent HUI from www.kitco.com]](http://www.weblinks247.com/indexes/idx24_hui_en_2.gif)
![[Most Recent Quotes from www.kitco.com]](http://www.kitconet.com/charts/metals/base/copper-d.gif)
![[Most Recent Quotes from www.kitco.com]](http://www.kitconet.com/charts/metals/base/zinc-d.gif)
![[Most Recent Quotes from www.kitco.com]](http://www.kitconet.com/charts/metals/base/aluminum-d.gif)
![[Most Recent Quotes from www.kitco.com]](http://www.kitconet.com/charts/metals/base/nickel-d.gif)
Sem comentários:
Enviar um comentário