terça-feira, julho 15, 2008
Bear Market: até quando?
Impressionante o volume do S&P500 de hoje, só semelhante à sessão de Janeiro em que a FED esmagou os juros e conseguiu uma fugaz recuperação do mercado.
Continuamos, assim, com um acento tónico muito negativo a médio prazo, embora seja provável a qualquer momento um pequeno rebound para fazer respirar alguns indicadores de mercado (como o RSI) que andam bastante esticados.
quarta-feira, junho 11, 2008
Ouro negro dita a sua lei
O petróleo está a alimentar a crise na economia mundial e, se os aumentos persistirem, podem agudizar-se dramaticamente as dificuldades da generalidade dos países.
Em primeiro lugar, afectam o consumidor - já atingido por graves problemas no seu rendimento disponível por via do rebentar da bolha especulativa no mercado da habitação. Em conjugação com isso, a situação económica em geral está enfraquecida e o preço das demais matérias primas estão em escalada, o que faz temer que a inflação possa voltar a níveis até há pouco tempo inimagináveis.
Uma palavra para as previsões sobre a cotação futura do petróleo. Enquanto organizações reguladoras mundiais e instituições bancárias credenciadas não hesitam em apostar na continuação das subidas no médio prazo, o Presidente da GALP reitera a sua convicção de que os preços virão de novo muito para baixo dos 100.
É caso para dizer que prever o futuro desta commodity se tornou um jogo de adivinhação sem grande racionalidade.
segunda-feira, abril 28, 2008
Escapando a uma recessão grave?
 Click chart to enlarge
Chart courtesy of http://stockcharts.com
quarta-feira, abril 16, 2008
Tendência de baixa persiste
 Click chart to enlarge
Chart courtesy of http://stockcharts.com
Com efeito, após o final de Janeiro houve sucessivos registos de lower highs (1388.34 e 1386.74) e lower lows (1256.98), num padrão que por agora não permite pensar numa inversão do mercado.
Será possível que o SPX esteja a criar um grande fundo de médio prazo mas essa hipótese só começará a ser credível se o índice ultrapassar a zona de 1396 de uma forma consistente e sustentada
sexta-feira, fevereiro 01, 2008
Análise ao SPX
 Click chart to enlarge
Chart courtesy of http://stockcharts.com
Analisando o SPX, em termos de síntese, podemos dizer o seguinte:
1. Desde o máximo de Outubro, a descida tem sido a tónica dominante.
2. A EMA50 cruzou em baixa a EMA 200 há cerca de 3 semanas.
3. O sólido suporte na zona 1370/1380 foi quebrado decisivamente em baixa há 2 semanas. Concretamente, a linha de breakdown foi aos 1384.
4. Os indicadores principais em termos semanais estão desfavoráveis. No diário alguns apontam recuperação, aliviando da carga negativa anterior.
5. 4ª feira, o SPX testou os 1384 e recuou e ontem fez o mesmo.
Existe a probabilidade de se desenvolver um rebound de maior amplitude, que poderá atingir os 1406 e até os 1423, sem colocar em causa a tendência descendente que vigora desde Outubro. Vamos ver se se confirma na prática a minha previsão de que o Bear Market já chegou.
quinta-feira, janeiro 31, 2008
Alteração da tendência do mercado?
Os mercados estão numa fase extremamente difícil. Muita gente, com alguma razão, aproveita uma altura como esta para ficar de fora. Com efeito, não só a tendência principal está a ser posta em causa como a volatilidade é muito grande, com o mercado extremamente sensível e parecendo ter reacções irracionais.
É evidente que quem acompanha e negoceia o SPX deve estar preparado para esta situação, aceitando que se está a viver um período complicado que implica uma atenção especial. É fundamental não cair no erro, que muitas vezes cometemos, de querermos ver a “nossa lógica” transposta para o movimento de preços. Não nos podemos esquecer que a lógica do mercado é a única que conta.
Estamos possivelmente já bem dentro do Bear Markert, desde Outubro do ano passado, ou será isto tudo somente uma grande correcção? Na minha opinião, existem muitos sinais a indicar que a primeira hipótese será a verdadeira, ainda para mais com aqueles dois cortes de juros de 1,25% em oito dias que dão uma ideia de problemas muito graves na economia e nos mercados financeiros. Se esses cortes na taxa de juro, e outros que se seguirem, tiverem algum êxito, os seus reflexos positivos só se sentirão num período que normalmente medeia entre 6 meses a um ano.
No final do dia de hoje, apresentarei um update da situação do SPX.
sexta-feira, novembro 23, 2007
Not yet golden but Sterling
 Click chart to enlarge
Chart courtesy of http://stockcharts.com
domingo, outubro 21, 2007
Back to the Junior Miners
 Click chart to enlarge
Chart courtesy of http://stockcharts.com
The company produces and develops gold projects in the states of Minas Gerais and Ceará, Brazil.
With an excellent technical picture, JAG seems to be able to reach its target production of 300,000 ounces in 2009.
Jaguar has measured and indicated resources of 17,572,460 tonnes containing 2,894,860 ounces of gold and 5,923,300 tonnes of gold classified as inferred resources containing 850,210 ounces. The Company intends to expand its low-cost operations in multiple phases over the next several years to exploit the anticipated increase in proven gold resource base.
terça-feira, outubro 16, 2007
Google Numbers
Following another straight upleg, indicators have become overbought. The upside remains strong but a necessary correction is underway.
We are also waiting that Google announce third quarter 2007 financial results.
sábado, outubro 06, 2007
Copper to see where we stand
Are subprime problems over? I don´t think so. It is likely that in the near future we may see more rate cuts in order to restore faith on growth capabilities.
I think we have an important commodity like copper that emulates nicely the strength of the world economy. So, unless extreme circumstances arise, copper prices will reflect market demand letting us know if we are on an expansion environment or not.
Looking at the chart we see that a remarkable correction took place which ended in last February. Since then copper have climbed dramatically from 238 to 380 in May. From there we have witnessed a strong consolidation and if the USD remains around 78 or less we should expect to see a breakout to meet and leave behind the 395 of May 2006.
So, the big picture seems solid even if a correction may be on the cards in the short term.
Let´s keep an eye on this development.
sexta-feira, julho 27, 2007
Research is important
With last days price changes we have to conclude:
First, we can´t have shares climbing nonstop.
Second, gold and silver are still consolidating for now.
As always, we must pick specific value growth stocks and keep them (though with a dynamic management). That implies some very hard work (to find them).
So, let´s do just that!...
sexta-feira, junho 01, 2007
Another critical juncture
 Click chart to enlarge
 That´s a fine chart. It presents the S&P 500 (blue line), the most important world index, and the same S&P500 priced in Gold (gray line), which shows the cost of the S&P 500 in ounces of Gold and is called the S&P 500/Gold ratio. It has been overlaid onto the chart for ease of comparison.
Will the S&P 500 go on climbing and manage to stay above all time highs? Though is obviously hard to answer, if that should be true we might well see gold catching up strongly. Today it takes 2.3 ounces of gold to “buy the S&P 500”, which is less than half of what we had to “pay” well back in 2000.
A curious conclusion is that the S&P may be headed to a sort of parabolic move somewhere in the future and that Gold seems solid anyway we look to the picture.
domingo, março 18, 2007
Wait and see
 Click chart to enlarge
Chart courtesy of http://stockcharts.com
Gold fights but goes nowhere. But, sure, the bias still is bullish on the long run. Meanwhile, Copper is in all evidence catching up. It seems that is trying to reach the right price (see chart).
The USD may continue to go down but it will be a very tough process.
Meanwhile, the Dow and other even more important indexes like NASDAQ and SP500? Are they only correcting? We are indeed on a crucial juncture...
sexta-feira, fevereiro 16, 2007
An excellent confirmation
Cumberland Resources (CLG), a top junior gold miner, shines nicely making a strong point about its value and way up on a most sustained trend.
Maybe now a small correction is in the cards, after such a gap up. Or is it indeed? Cumberland is to be acquired by Agnico-Eagle Mines, so the general move is to the north!
quinta-feira, fevereiro 08, 2007
Time for the Yen
Yen is too low. Japan´s economy is growing and it is possible that BoJ raises rates again this year. Maybe we have seen a bottom at 81.91. Gap at 84.24 is a possible upside target.
segunda-feira, janeiro 15, 2007
An ugly setup
Usually when we see a stock well under its EMA200 it is better not to try to catch a bottom.
But with Motorola (MOT) I think that its estimated revenues and profits for the last quarter of 2006 don´t match with such dumping stock prices. It is my belief it won´t take a very long time to close the gap down that is damaging the chart.
In other words: it is possible that, for now, we have actually found that bottom…
Blog Changes
There are always great opportunities on several markets and on specific securities. So, there is no point in restricting our action and remain only in precious metal stocks.
From now on, and every time I see convincing chances of a promising investment, whatever the market maybe, I will present one particular stock, index, commodity or currency and tell you my opinion about it.
domingo, dezembro 31, 2006
Stocks of the Year
During 2006, the best performances in precious metal stocks - among a selected but large group I am following - are:
1. Blue chips
Agnico-Eagle Mines (AEM), with an astonishing jump from less than 20 to 41.24. Key explanation: strong earnings from LaRonde Mine in Quebec, Canada´s largest gold deposit in terms of reserves.
2. Junior miners
Tara Gold (TRGD), with a thrilling walk from 0.05 all the way to 1.32! Key explanation: New discoveries and project development.
Happy New Year!
quarta-feira, dezembro 27, 2006
Will Copper hold?

Click chart to enlarge
Chart courtesy of http://stockcharts.com
Copper is very important. After a couple of huge mountains drawn by RSI indicator, we may observe a unique setup of the significant weekly EMA65.
Take also a look to the disproportion of levels between the two moving averages shown in the chart.
sábado, dezembro 09, 2006
Osisko once again

Charts courtesy of http://stockcharts.com
What a shoot up since August 2004 when the price was just C$0.24!
It is the result of late discoveries in the Canadian Malartic gold deposit, a very promising property 100% owned by the company. Inferred resource is estimated to be around 6.5 million ounces of gold.
Presently, Osisko has only 65,6 million fully diluted shares.
Examine these interesting two years and six months charts.
segunda-feira, novembro 27, 2006
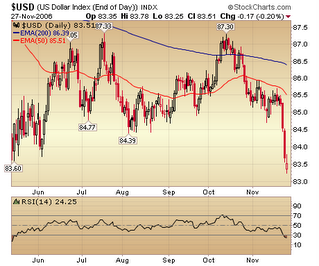
USD by itself
 Click chart to enlarge
Chart courtesy of http://stockcharts.com
Let´s see what will happen and what kind of reaction we may observe on Gold.
sexta-feira, novembro 24, 2006
More Charts
Trying to make this blog more useful, I have displayed more graphics of metal prices and related indicators updated every minute. Now you may follow from here the intraday prices of Gold, Silver, Platinum, Palladium, HUI, USD Index, Copper, Zinc, Nickel and Aluminum.
My goal is to show everything that matters. Thank you for coming here!
domingo, novembro 19, 2006
Tara Gold Resources
Tara Gold (TRGD) is a growth-oriented precious metals exploration and development company by re-initiating and increasing production levels at La Currita, Lluvia de Oro and Picacho, and developing the San Miguel, La Millionaria, Pilar De Mocoribo and Las Minitas projects in Mexico.
Last week the company bought Don Ramon and Lourdes mineral concessions near Pilar De Mocoribo. Preliminary evaluation indicates that the property lies within a larger area that hosts numerous and very-high grade Pb-Zn-Ag Carbonate (Limestone) hosted deposits.
Tara Gold has initiated La Millonaria Production Plant, which contain an estimated 30,000 tonnes grading of 9.702 g/t gold and 23 g/t silver.
This junior miner is well in action and has very good potential not only on precious metals but also on base metals.
sexta-feira, novembro 10, 2006
Let´s go!
 Click chart to enlarge
Chart courtesy of http://stockcharts.com
But they were not alone as Agnico (AEM), Harmony (HMY), Silver Wheaton (SLW), Abcourt (ABI.V), Ivanhoe (IVN), Gold Reserve (GRZ), Miramar (MNG), Eurozinc (EZM), Yamana (AUY), Aurelian (ARU.V), among others, had rallied for the last four weeks.
terça-feira, novembro 07, 2006
Kinross merges with Bema
If Toronto’s Kinross Gold (NYSE:KGC) succeeds in its all-share $3.1 billion merger with fellow Canadian Bema Gold, Kinross will move up in the senior ranks of gold producers.
Each Bema common share would be exchanged for 0.441 of a Kinross common share, representing a 34% premium. After the transaction is completed, 61% of new Kinross would be held by Kinross shareholders and 39% by Bema shareholders. If the transaction fails, Bema (NYSE:BGO) would pay Kinross a $Cdn$79 million break fee.
Analysts were not enthusiastic about the prospect of Kinross taking on Bema’s ownership of the Cerro Casale project in Chile. While Cerro Casale is estimated to contain proven and probable resources of 23 million ounces of gold and 6 billion pounds of copper, analyst Mark Smith of Dundee Securities declared “the project’s awfully expensive,” requiring an initial capex of $2 billion. Both Placer Dome and Barrick have decided against developing the project.
sábado, novembro 04, 2006
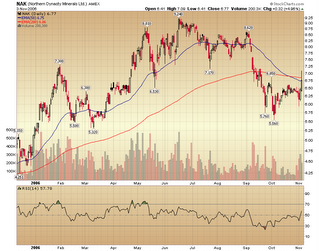
Northern Dynasty Minerals
 Click chart to enlarge
Chart courtesy of http://stockcharts.com
Northern Dynasty (NAK) is advancing the Pebble Project, located in southwestern Alaska, USA, that hosts a world class gold-copper- molybdenum deposit, comprising 22,582 hectares.
The estimated mineral resources in the Pebble East and West deposits are of 54.8 million ounces of gold, 44.7 billion pounds of copper and 2.7 billion pounds of molybdenum.
There is excellent potential to establish significant additional resources with further drilling. Northern Dynasty is now establishing programs in order to integrate this exceptional discovery into an overall mine plan that is optimal for the project.
This an extraordinary project, located on American soil and the company is assessing the merits of building a consortium to permit, finance, construct and operate a modern and long life mine with very substantial annual metal output.
This is the biggest gold discovery ever in North America and majors are already on the race to take over. The first step was already taken last June when Rio Tinto affiliate Kennecott Canada Exploration acquired 9.9% interest in the company.
domingo, outubro 29, 2006
Base metals supercycle remains intact
The recent strength of base metal prices has confounded the sceptics. Lead, zinc and nickel have all hit all record levels while tin has surged to its highest level since 1989. Such gains have defied the forecasts of many investors who believed that the peak in the cycle for metal prices had passed.
US oil prices have declined by a quarter since early August but base metals have largely resisted crude’s gravitational influence, displaying unexpected price resilience in the face of a US economic slowdown and concerns about its impact on global demand growth.
sábado, outubro 28, 2006
NovaGold says no to Barrick
Barrick Gold raised its all-cash bid for Vancouver junior NovaGold by 10.3% to $16 per share Tuesday. The offer values NovaGold at $1.7 billion on a fully diluted basis.
NovaGold has three major assets, including the Donlin Creek project in Alaska in which Barrick is the joint venture partner, with gold resources estimated at 14.8 million ounces, and 100% interest in the Galore Creek project in British Columbia, estimated to have measured and indicated resources of 6 million ounces of gold, 75 million ounces of silver, and 6.8 billion pounds of copper.
However, NovaGold urged its shareholders to take no action at this time. In a news release issued Tuesday, the company said it has achieved “a series of major development milestones on its projects".
quinta-feira, outubro 26, 2006
Our stocks
domingo, outubro 22, 2006
Gold

Chart courtesy of http://stockcharts.com
The most important thing about Gold and its very long term bull run is sustainability. That is exactly what we are founding here with the detail of being EMA50 that is giving a perfect support. Don´t get it wrong, this is a weekly chart and prices are consolidating to go higher.
Silver

Chart courtesy of http://stockcharts.com
That´s a solid a picture that make us believe we may start a rally anytime soon.
sábado, outubro 21, 2006
Copper
A fine (and symmetrical) consolidation. If it follows 2004/05 we have to wait sometime for a new rally…
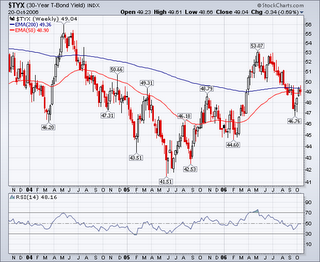
Yields
 Click chart to enlarge
Chart courtesy of http://stockcharts.com
Time for consolidation. Bond investors believed that a significant slowdown was on the cards but now they are not so sure.
sexta-feira, outubro 20, 2006
Crude Oil
Since August, Crude Oil has been falling sharply. It seems we have to wait a little more to see a bottom.
Dow/Gold

Yesterday, the Dow edged above the 12,000 milestone for the first time. Considering the magnitude of the past bear market, it is a great achievement indeed. For some further perspective into the current rally, today's chart presents the Dow divided by the price of one ounce of gold. This results in what is referred to as the Dow / Gold ratio or the cost of the Dow in ounces of gold. For example, it currently takes 20.1 ounces of gold to “buy the Dow”. This is considerably less that the 44.8 ounces back in the year 1999. When priced in gold, the current stock market rally hasn't amounted to much. In fact, the longer-term trend is actually down!
"In the absence of the gold standard, there is no way to protect savings from confiscation through inflation. There is no safe store of value." - Alan Greenspan
quinta-feira, outubro 19, 2006
AURELIAN RESOURCES
 Click chart to enlarge
Chart courtesy of http://stockcharts.com
Aurelian Resources (ARU.V) is called a junior miner because it is only on an early developing stage of its gold project and not yet near production.
But ARU has a super first class mining property registering reserves of 8 million ounces of gold with 80% of targets yet to be explored!
It is surely a highly profitable investment even at these levels. I will write a more detailed post about this company in the near future.
quarta-feira, outubro 18, 2006
IVANHOE MINES
 Click chart to enlarge
Extraordinary junior miner companies never disappoint. IVANHOE got a partnership deal with Rio Tinto and is up more than 30%.
Early on this blog I have expressed my opinion that the price of this stock could rally, with the possibility of going even higher than today´s level.
Nevertheless, I advise you to be cautious and trade a portion at your will, having a stop and following the action.
terça-feira, outubro 17, 2006
Gold and Oil again
Gold is loosing the battle with its EMA 50, which should be expected to happen this month and is looking the horizon from below. There is in place an unpleasant succession of lower highs and lower lows. A descending trend line, for now far enough from 540.
Is it possible that Gold will be trading downwards or sideways till the end of the year? Not likely.
On the other hand, with a few exceptions, every year over the last 15, Crude Oil has found its second half bottom in November or December. There is surely something here to think about.
Is it possible that Oil has already reached a bottom last week? I don´t think so.
After United States elections, we must assess these issues once more.


![[Most Recent Exchange Rate from www.kitco.com]](http://www.weblinks247.com/exrate/24hr-jpy-small.gif)
![[Most Recent Exchange Rate from www.kitco.com]](http://www.weblinks247.com/exrate/24hr-chf-small.gif)
![[Most Recent Exchange Rate from www.kitco.com]](http://www.weblinks247.com/exrate/24hr-cad-small.gif)
![[Most Recent USD from www.kitco.com]](http://www.weblinks247.com/indexes/idx24_usd_en_2.gif)
![[Most Recent Quotes from www.kitco.com]](http://www.kitconet.com/images/live/s_gold.gif)
![[Most Recent Quotes from www.kitco.com]](http://www.kitconet.com/images/live/s_silv.gif)
![[Most Recent Quotes from www.kitco.com]](http://www.kitconet.com/images/sp_en_6.gif)
![[Most Recent HUI from www.kitco.com]](http://www.weblinks247.com/indexes/idx24_hui_en_2.gif)
![[Most Recent Quotes from www.kitco.com]](http://www.kitconet.com/charts/metals/base/copper-d.gif)
![[Most Recent Quotes from www.kitco.com]](http://www.kitconet.com/charts/metals/base/zinc-d.gif)
![[Most Recent Quotes from www.kitco.com]](http://www.kitconet.com/charts/metals/base/aluminum-d.gif)
![[Most Recent Quotes from www.kitco.com]](http://www.kitconet.com/charts/metals/base/nickel-d.gif)